Of Measuring Altitude, Digital Signal Processing, Tableau, and things that go "Whoosh!"

Few things are more satisfying than the “whoosh” of a model rocket launch. Here’s a video from earlier this year with my Estes Saturn V:
A key question I get about model rockets is “How high do they go?”
Well, good question. If I was a trigonometry nerd, I could figure that out using a string, protractor, another adult, a measured fixed distance from the launch pad, and SOH-CAH-TOA, then I could tell you. But since that situation is hard to come by, the easier method is to use an electronic altimeter. While vendors on the market (such as Estes, Perfectflight, Jolly Logic) have pre-built altimeter options, I often appreciate the value in building my own. Plus, it would give me an excuse to tinker with Arduino code and sensors myself. Lastly, in my research, I came across several others (One, Two, Three, Four) who built their own altimeters, so I was inspired! Let’s get started!
Altimeter Design and Construction
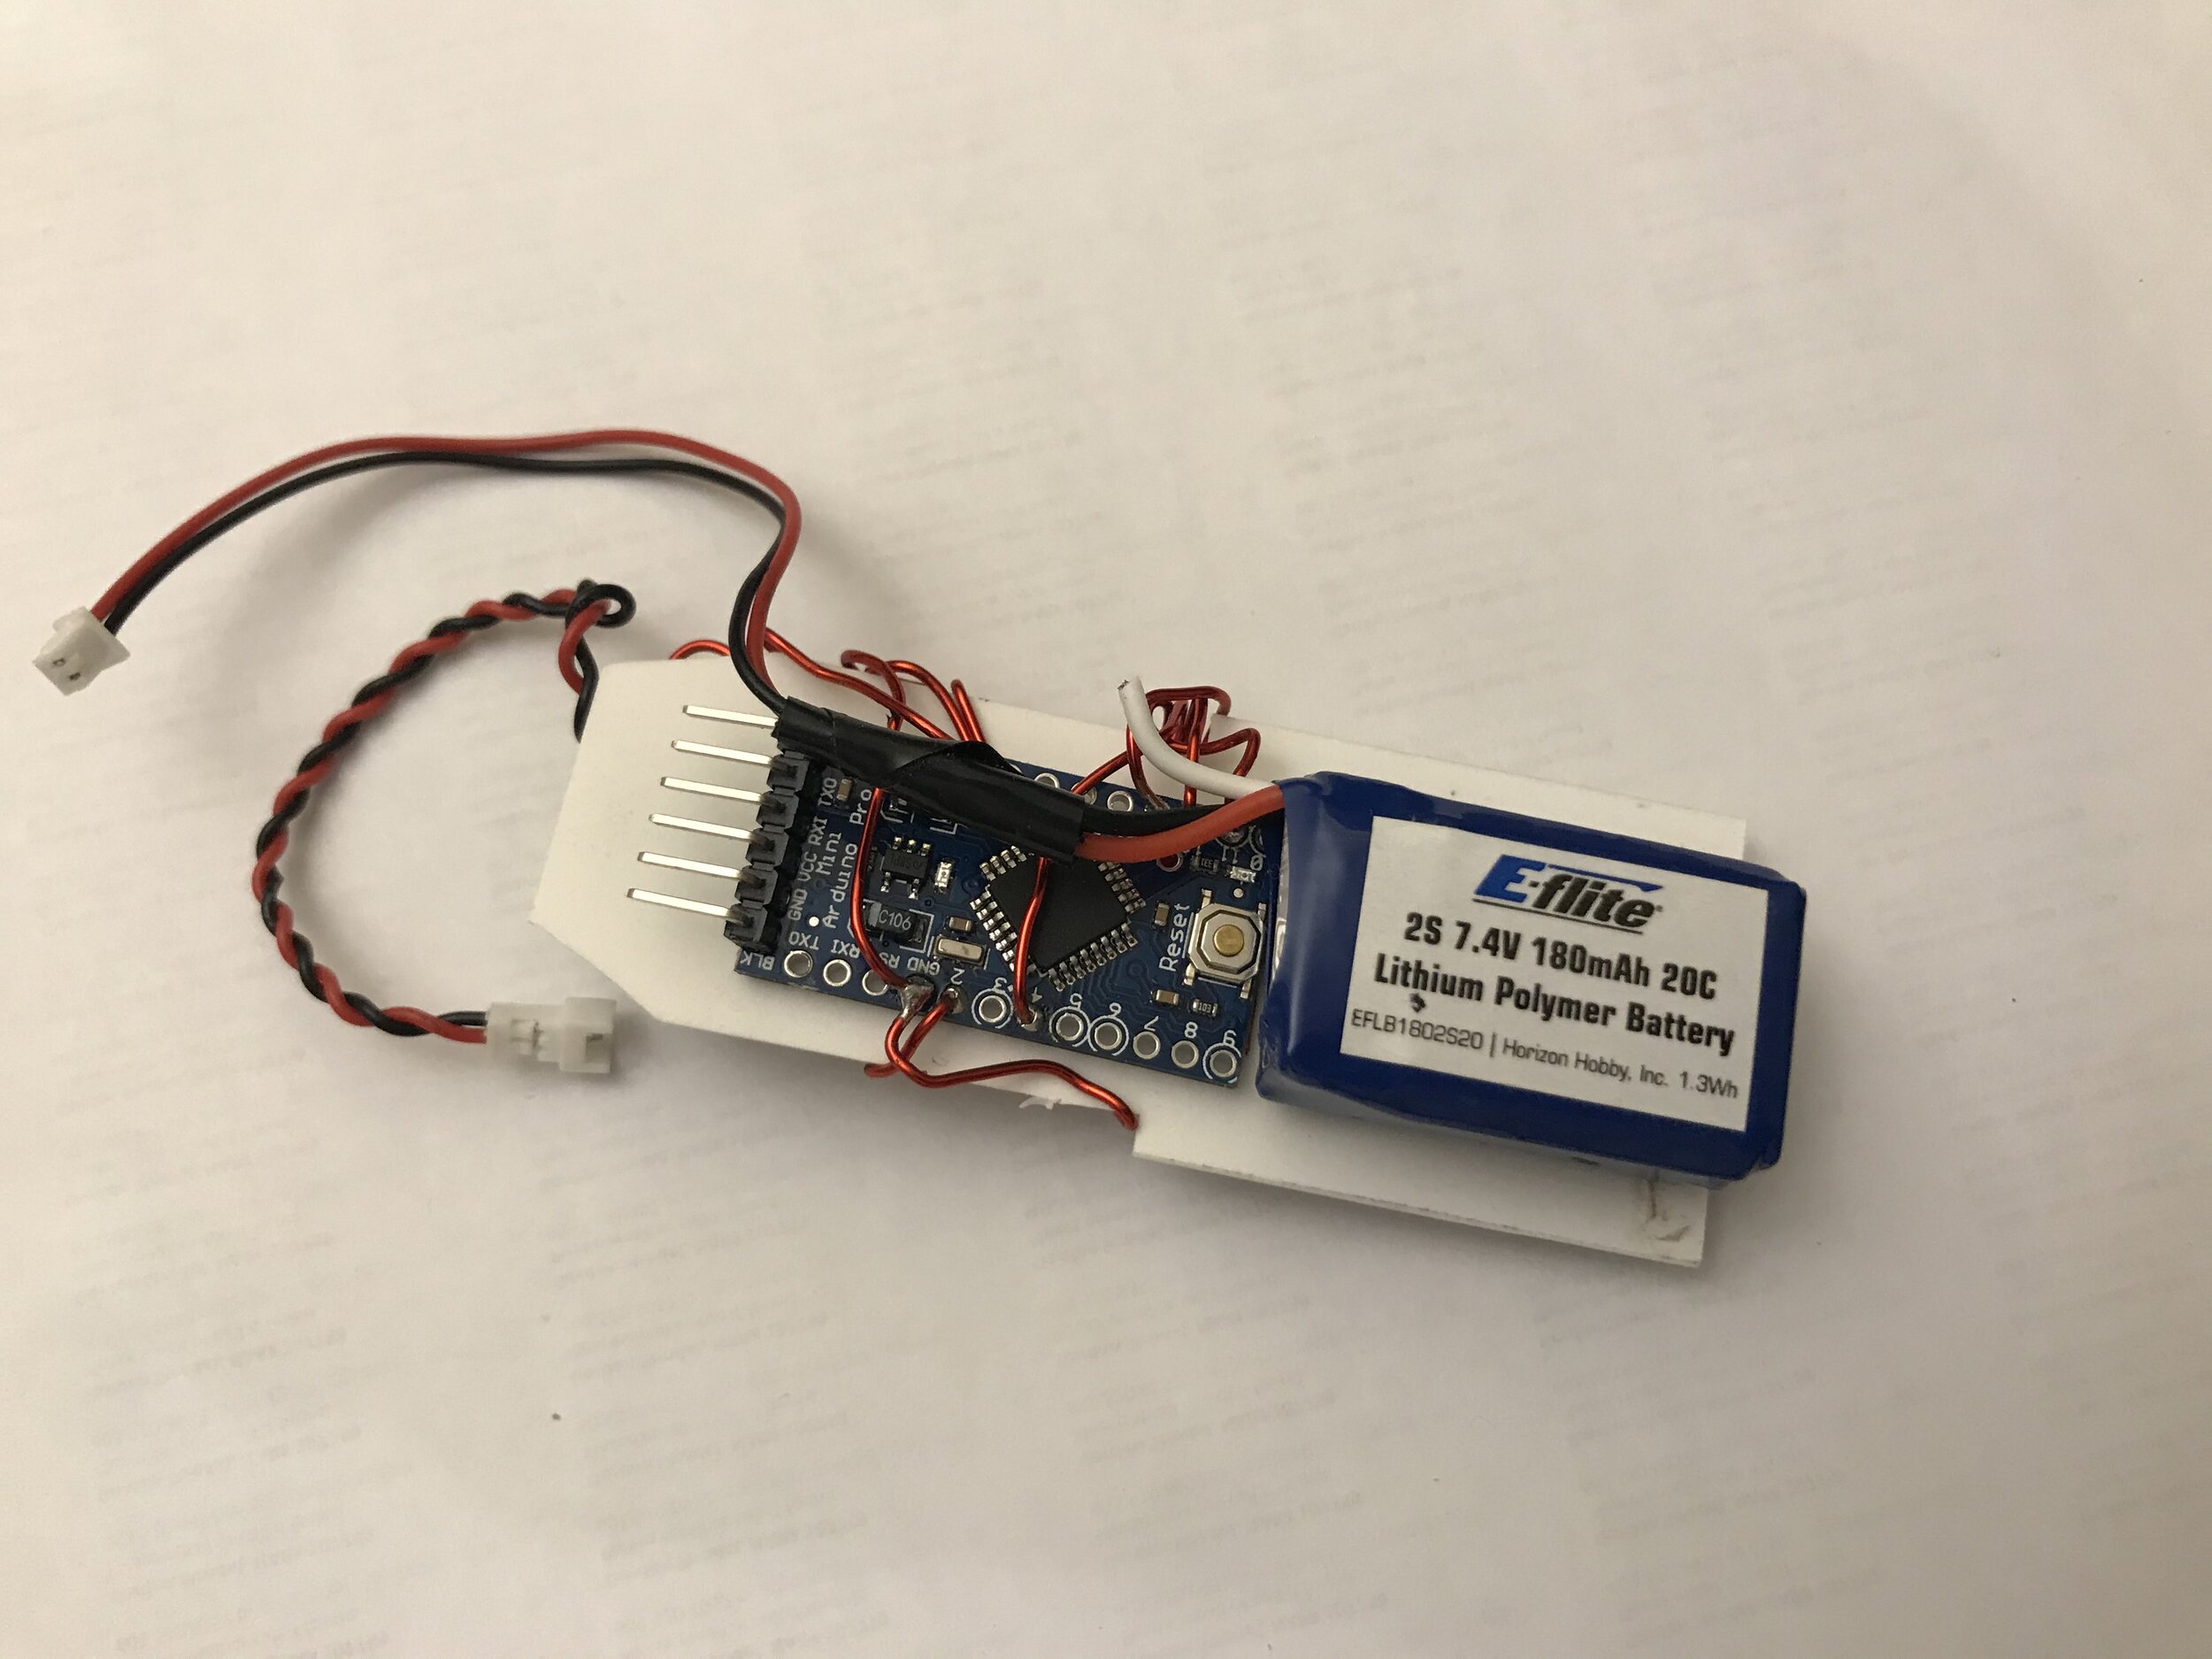
The data logger was based on an Arduino Mini Pro, with a LiPoly 2 cell battery, a GY-86 Instrumentation Unit (barometer, gyroscope, etc.), a micro-SD card reader, and a voltage regulator for taking 7.4V from the battery and smoothing it to 5V needed for the computer chips.
Bill of Materials:
- GY-86 IMU - NewEgg
- Arduino Pro Mini (5v, 16Mhz) - Amazon (or you can also order from NewEgg)
- 2-cell 7.4V Lipo Battery - Example on Amazon. (Ideally something in the 120mah to 200mah range)
- Micro SD card module - Adafruit makes a good one
- MicoSD card (one flight is 600-700KB depending on quickly you launch) - Amazon
- 5V voltage regulator - Amazon
- JST connectors for the power connection - Amazon
- Wiring for Making connections. I used this magnet wire, but it was a bit stiffer than I would use again if I was making another.
- FTDI Adaptor - NewEgg (or equivalent) - This is used for programming the Arduino Board
- 3M VHB Tape for mounting the electronics - Amazon
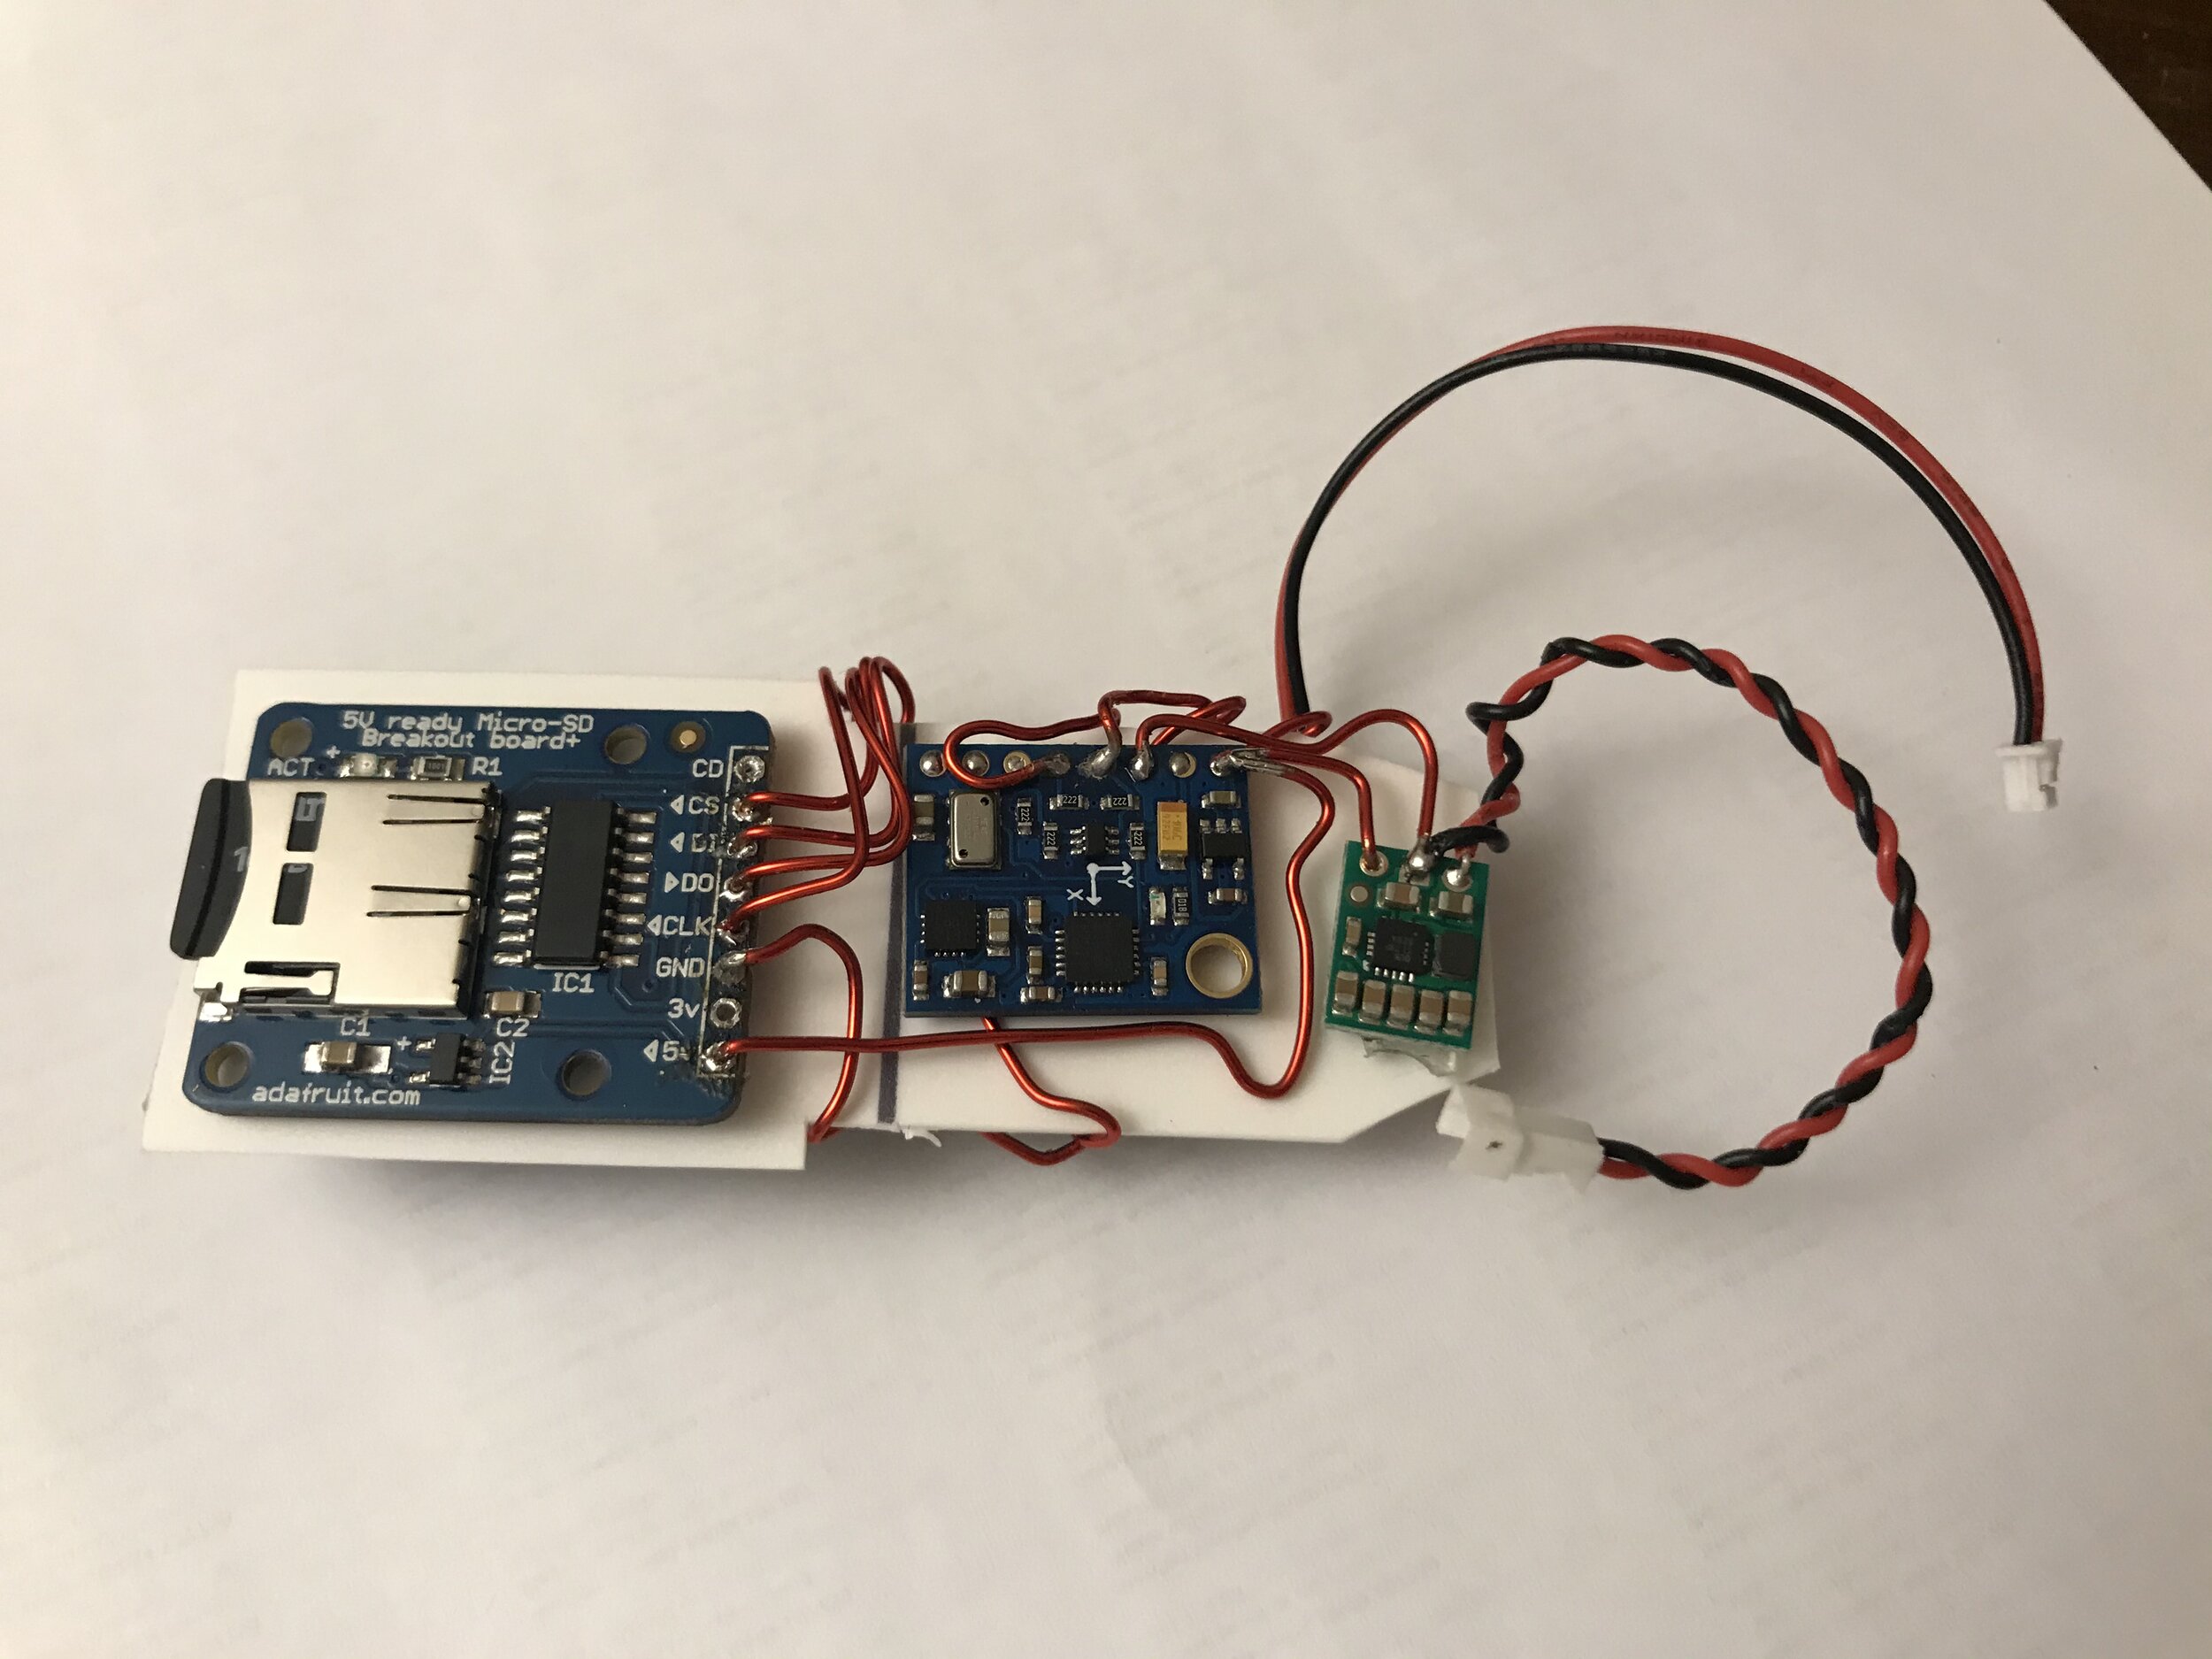
Wiring it all together
NOTE: Pay careful attention to the orientation on the GY-86. There is an XY-axes printed on the silkscreen, make sure that points toward where the nose-cone will be when it sits in the rocket!
Arduino Pro Mini:
- 5V to Output of 5V regulator (7.4V battery connects to input)
- GND to common ground across all chips and battery
- Sensors wired as below
SD Card Reader:
- CS - PIN 4 on Arduino
- CLK- PIN13 on Arduino
- DI- PIN 11 on Arduino
- DO- PIN 12 on Arduino
- Don’t wire CD or 3v.
- Wire 5V and GND as normal
GY-86 IMU:
- SCL - PIN A5 on Arduino
- SDA - PIN A4 on Arduino
- INTA - PIN 2 on Arduino
- Wire 5V and GND as normal
- Ignore the rest of the pins
Flash the Arduino just like you normally would with the IDE. (Arduino has a getting started guide if you are new to this.)
If the wiring works , then there is a red LED that blinks rapidly on the SD card reader when the SD is being read/written and the code is running on the chip. The IMU has a green LED that remains lit. The Arduino Mini also has a red LED which blinks. After a 1/2 second calibration, the sketch begins to log data to a text file on the SD card. The file will contain header-less data looking like this:
651,-103.06,31.97,102453,-1424,12196,13352
741,-98.85,32.19,102520,-4664,13180,12600
809,-98.94,32.23,102516,-2824,13360,7928
878,-97.94,32.26,102500,-2888,13116,6124
947,-96.63,32.27,102483,-3160,13204,11096
1015,-94.97,32.28,102469,-3456,13384,9852
1085,-94.97,32.30,102472,-4024,13648,8716
1154,-96.54,32.32,102495,-2376,12672,9404
Preparing the Data for Tableau
The raw data from the altimeter was captured in CSV on an micro SD card without headers. Luckily, I specified the format of the output in the Arduino code.
String Baro_data = String(timer + comma + absalt + comma + relalt + comma + temp
+ comma + realpressure + comma + accelXraw + comma + accelYraw + comma + accelZraw) ;
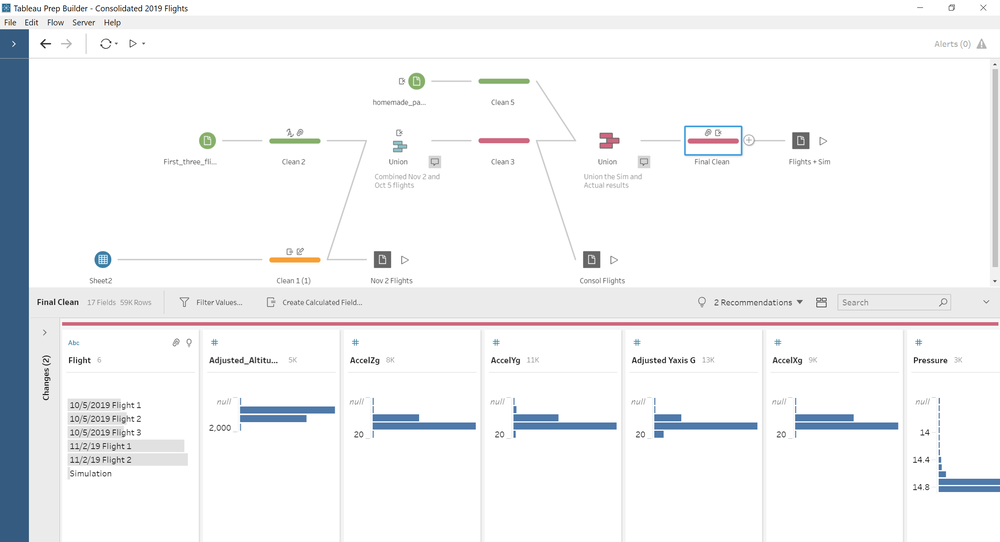
For each flight, the data logger appends the results to the existing “DATALOG.txt” file on the SD card. To make my life a bit easier and verify the altimeter was working, I downloaded the file after each flight. I then later split the files manually using the “Milliseconds” indicator of when a new flight started. Once you have it split into three files, I used Tableau Prep to clean and recombine the files into a CSV for my Tableau Workbook.
Since the data was raw, I had to apply a few transformations:
- I manually explored the milliseconds data to determine when the rocket was lauched, i.e. T-0. I then created a calculated field called “Adjusted Seconds” that basically zero’d out each flight to a predetermined point and converted to seconds. This will allow me to compare flights against each other for a common, abstracted time range.
- Likewise, I used the T-0 value for Altitude to zero out the altitude readings across the flights. Each flight has a slightly different offset, most likely due to the orientation of the data logger when I powered it on.
- I adjusted the Altitude reading in meters to feet.
- The Accelerometer captured raw values (coming from the A to D conversion), so I divided by 2048 to get “G’s.” I also applied an offset to the Accelerometer data in the Y-axis to try and get it closer to the expected 9.81m/s^2 that we are used to seeing in physics class.
- The temperature and pressure data was next to useless, so I left it was is.
Lastly, I wanted to compare the simulation against the actual results. However, the time basis of the simulation (0.1 second increments) and the actual results (0.069 seconds) were different, so I instead of joining the files in Tableau Prep, I used a Union and aligned the time and altitude columns together.
That means in Tableau Desktop, you need to use a dual axis chart to get it on the same screen. Notice the dual axis chart allows the table calculation on one measure and not the other. It was important to keep the two measures separate because the simulation didn’t need the table calculation for the Moving Average smoothing.
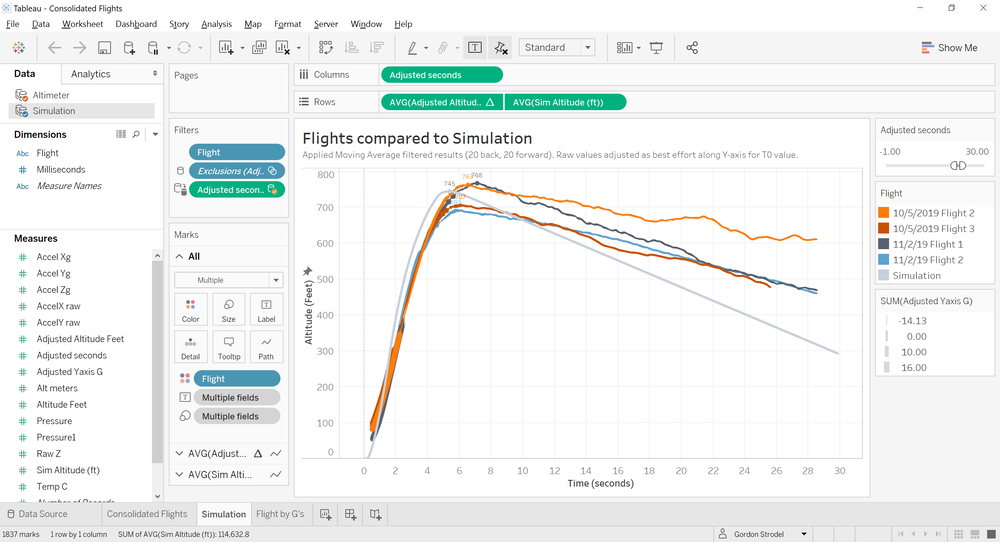
The following Tableau Public visualization shows some of the results of the flights. Note, the first flight on 10/5 was on a C-class motor, which is 1/2 as powerful as a D-class motor, hence the reduced altitude on that flight.
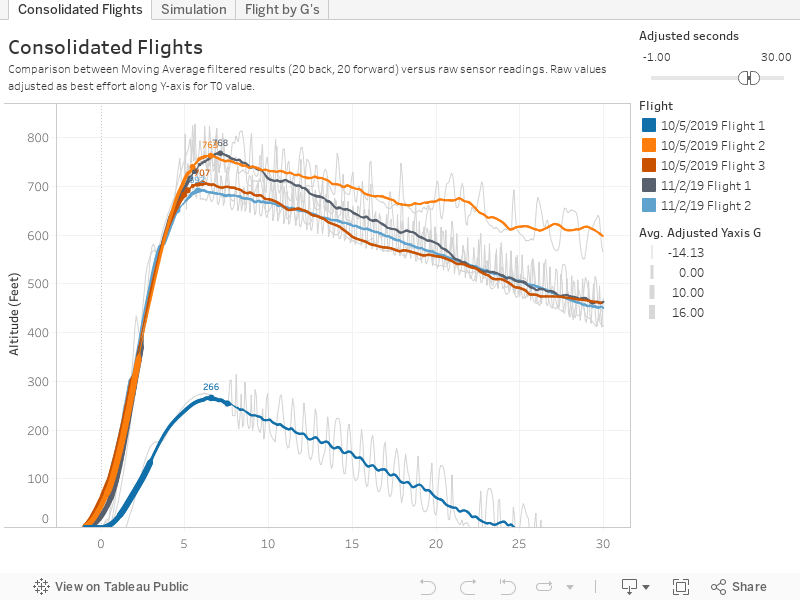
Note: Since the altimeter data was so wiggly, I put a Moving Average table calculation on the raw data. This essentially gave me a smoother RMS-like value across the raw values. (I used 20-points forward and 20-points backwards as part of the moving average.)
In comparing the simulation to the captured data, there are a few noticeable points for variance:
- Wind Conditions: Oct 5 was much quieter with respect to wind. The wind was also more steady. Nov 2 had much more variable wind with more gusts.
- Separation: The simulation doesn’t take into account the nose-payload bay (with data logger) descending separately from the booster airframe. As such, the decent is slower in real like, especially when you take into account wind drift.
- Boost Phase: The simulation doesn’t take into affect wind patterns or other anomalies during the first second or two of boost phase. Based on video recorded via my iPhone, both Nov 2 launches seemed to have multiple wind layers getting up to 800ft.
- Air Density: Oct 5 was significantly warmer (10 deg F) than November. This could have played a role.
Conclusion(s)
I was very pleased to see how closely my real-world results matched the simulation. One of the biggest impacts in the simulation results were the finish on the rocket (rounded leading edges on the fins, painted, etc.) and the weight. When I initially input the simulation, the altitude results were much higher than I anticipated, but once the weight and finish where adjusted, the results were much closer to what was measured!

- Rocket Featured on the Intro picture: SpaceX Falcon Heavy. Learn more on Wikipedia.
- Massachusetts Model Rocket Club: http://cmass.org/
- Original Instructable where I got the idea: https://www.instructables.com/id/Arduino-Rocket-Data-Logger/
- Rocket Model used in this testing was based on this model from Estes
- Open Rocket Simulator Software: Homepage
- Download a copy of my data logging sketch: Github